On this page
Chrome DevTools Keyboard Shortcuts for Mac: Inspect, Debug, and Test Websites Faster

WebbyCrown Solutions-
November 4, 2026-11 min read
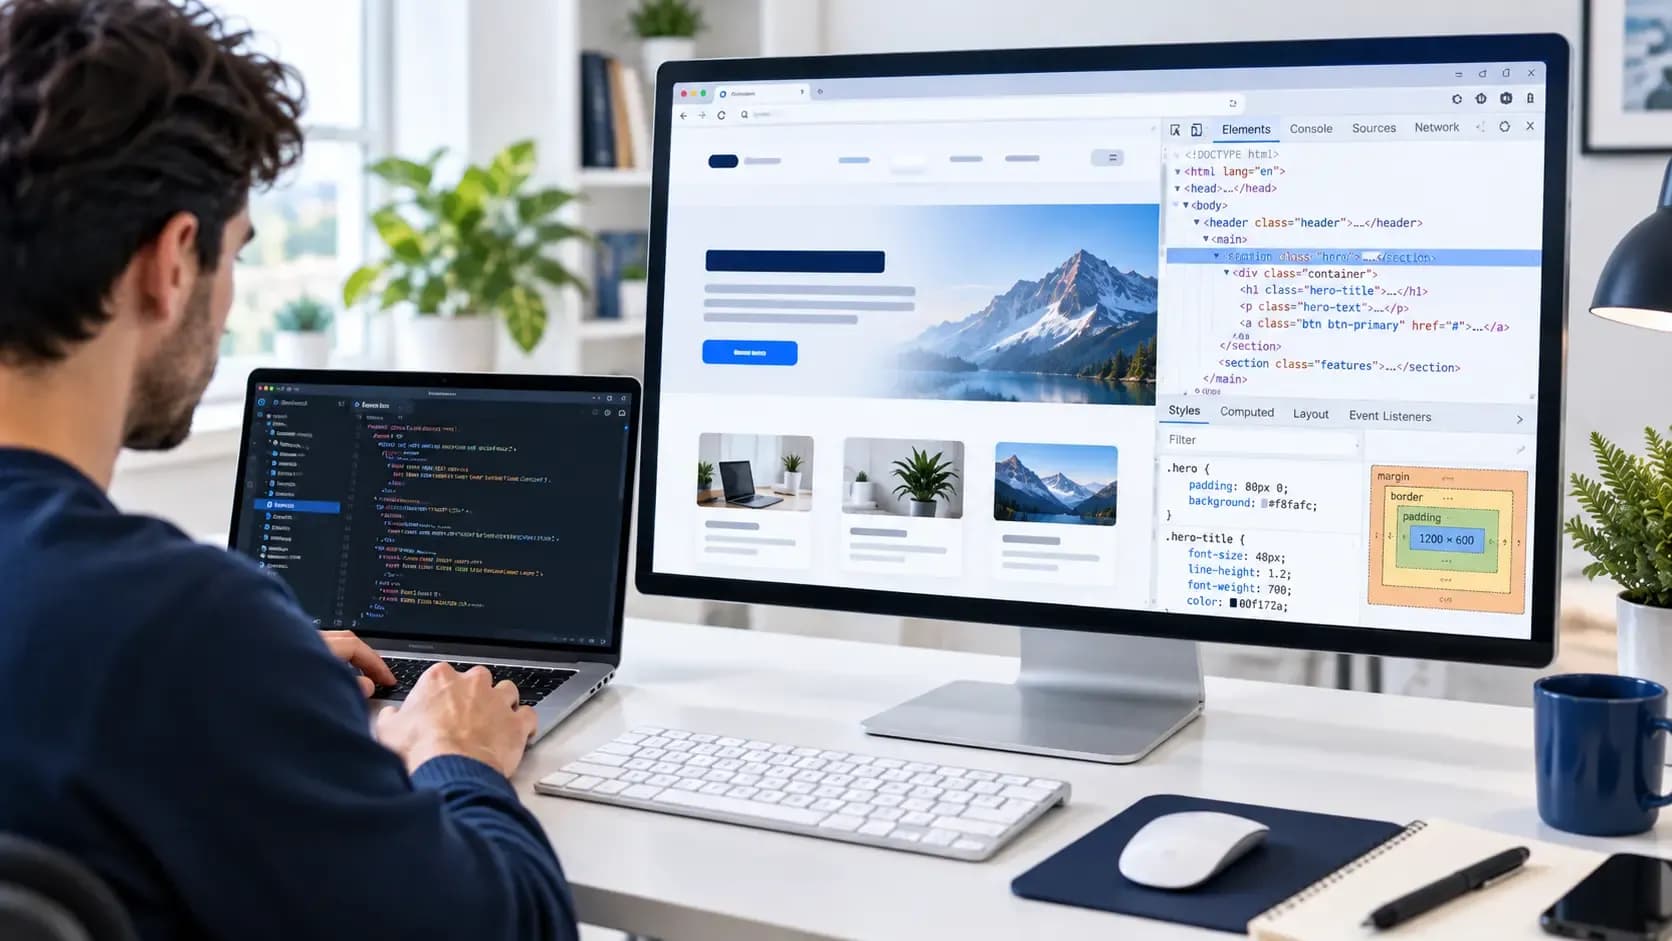
The fastest way to use Chrome DevTools on a Mac is to open the right tool for the problem: Command + Option + I opens DevTools, Command + Shift + C lets you inspect a page element, Command + Option + J opens the JavaScript Console, and Command + Shift + M toggles device mode when DevTools is focused. These shortcuts become most useful when you connect them to a repeatable debugging workflow.
If you customize HTML website templates, you can use DevTools to investigate unexpected spacing, missing images, CSS overrides, console errors and mobile layout problems. This guide goes beyond a shortcut list by showing what to inspect, what evidence to record and how to carry a tested change back into your source files.
If you also want to speed up everyday navigation, app switching, and screenshots outside the browser, start with these Mac keyboard shortcuts for developers.
For a desk-side reference, download the Chrome DevTools Mac shortcuts quick reference.
Download the printable Mac shortcuts PDF: Download.
Chrome DevTools Shortcuts on Mac: Quick Reference
| Task | Mac Shortcut | Where It Works |
|---|---|---|
| Open DevTools | Command + Option + I | Browser viewport |
| Open Console | Command + Option + J | Browser viewport |
| Open Elements / Inspect | Command + Shift + C or Command + Option + C | Browser viewport; inspect behavior may depend on focus |
| Toggle Inspect Element Mode | Command + Shift + C | DevTools focused |
| Toggle Device Mode | Command + Shift + M | DevTools focused |
| Open Command Menu | Command + Shift + P | DevTools focused |
| Find Within Current Supported Panel | Command + F | Supported DevTools panel |
| Search Across Loaded Resources | Command + Option + F | DevTools focused |
| Open a Source File | Command + P or Command + O | DevTools focused |
| Hard Reload | Command + Shift + R | Browser viewport |
| Clear Console | Command + K | Console focused |
| Start/Stop Network Recording | Command + E | Network panel focused |
| Toggle Drawer | Escape | DevTools focused |
These Mac bindings come from the official Chrome DevTools keyboard shortcut reference. Shortcut behavior is context-sensitive. The active Chrome window, focused panel, macOS keyboard layout and any shortcut customizations can change what happens when you press a combination.
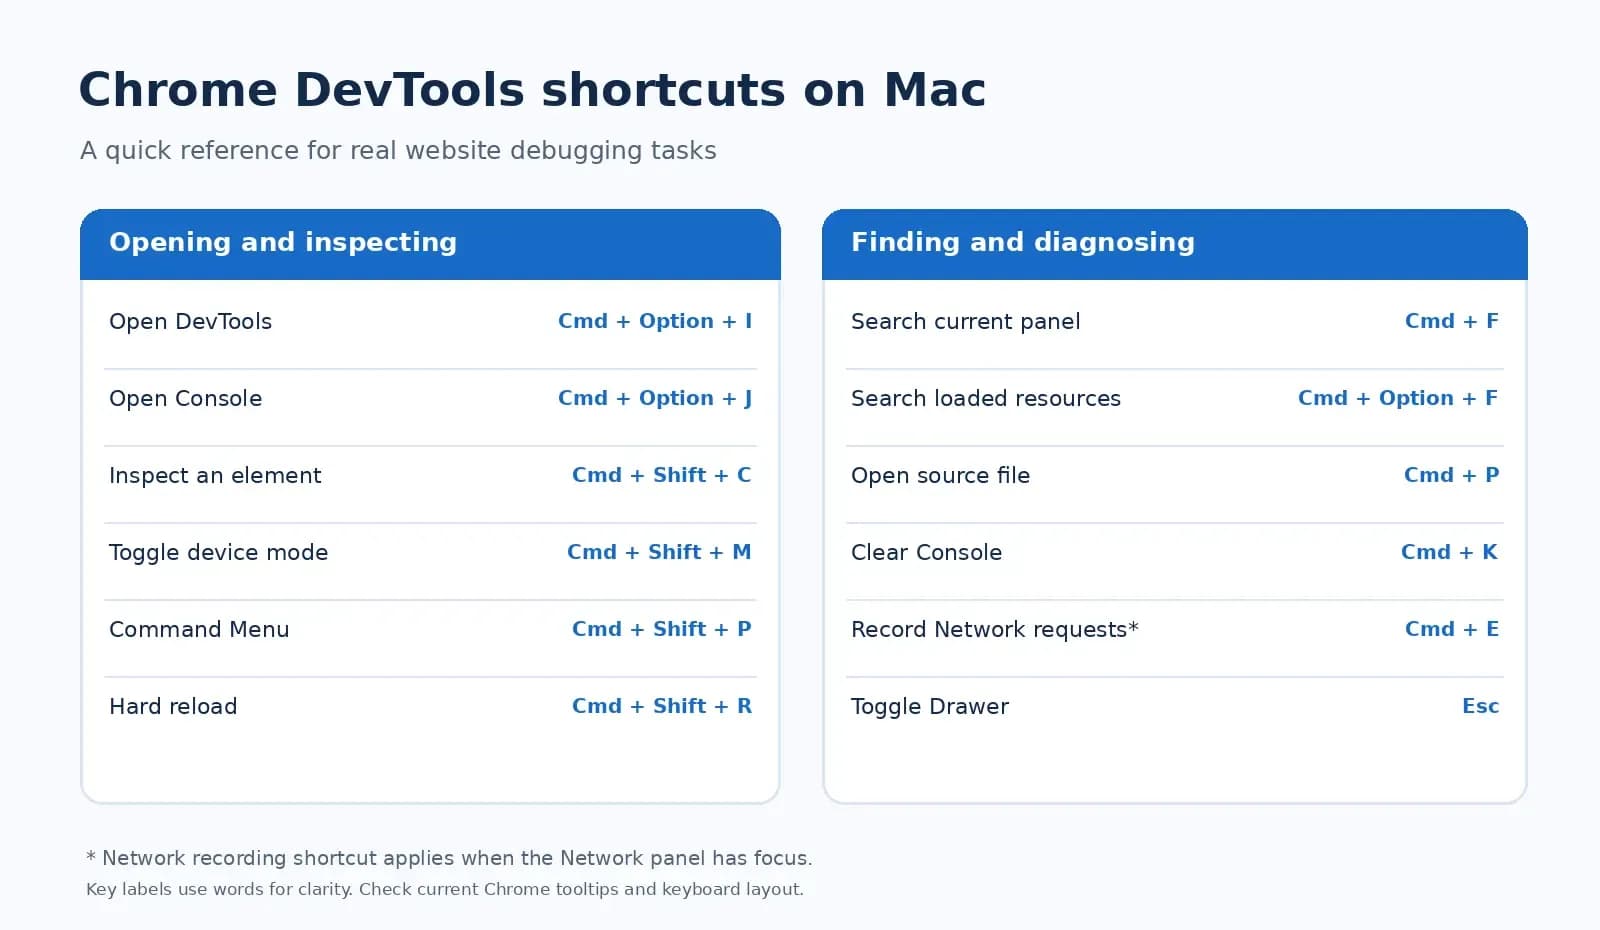
Shortcut reference illustration — use the table above as the accessible text alternative.
1. Open DevTools and Choose the Right Panel
Start by opening the webpage you want to inspect in Chrome. Press Command + Option + I. Chrome opens DevTools with the panel you most recently used. If the problem is visual, select Elements; if a script is failing, use Console or Sources; if a file is not loading, use Network.
You can jump directly to the Console from the browser viewport with Command + Option + J, or open Elements with Command + Option + C. Command + Shift + C activates element inspection and is also an alternative way to reach Elements.
Be deliberate about focus. For example, Command + Shift + M toggles device mode when DevTools is active; if your focus is elsewhere, the combination may trigger a different browser or application action. The small shortcut hints in DevTools tooltips are a useful way to verify the current environment.
2. Inspect HTML and CSS Instead of Guessing
A common template-customization problem is a section that looks fine in a desktop mockup but breaks when real text and images are added. The Elements panel lets you select the relevant node, examine its computed box dimensions and inspect the CSS rules that actually apply.
Worked example: a hero image is wider than its container
The following code is a teaching example, not a reported test of a WebbyTemplate product. Imagine a page with this markup:
alt="Team collaborating in an office">
Build your next project
The stylesheet contains a rigid image rule:
.hero-card img {
width: 960px;
}
Press Command + Shift + C, select the image and inspect its width in Styles and the box model. If the image exceeds a narrower parent, test a flexible rule in DevTools:
.hero-card img {
display: block;
max-width: 100%;
height: auto;
}
Now resize the viewport and see whether the image remains within the container. If the result solves the problem, update the actual CSS source in your editor and reload. A change made in the DevTools Styles pane is a temporary browser-side experiment unless you have separately configured a persistence workflow.
For a broader explanation of CSS inspection, use Google’s View and change CSS tutorial.
3. Adjust CSS Values Precisely with the Keyboard
After selecting an element, use the Styles pane to move through editable declarations. Chrome’s documented shortcuts include the arrow keys for changing numeric property values. Clicking a numeric value and pressing Up or Down changes it by 1; Shift + Up/Down changes it by 10; Option + Up/Down changes it by 0.1.
This is helpful when a button needs small spacing adjustments. Test the change visually, then note the final value and move it to your source file. Avoid treating a temporary adjustment as a validated responsive fix until you have checked other widths and states.
4. Use the Command Menu for Actions You Cannot Remember
Press Command + Shift + P while DevTools is focused to open the Command Menu. Rather than memorizing the navigation path for every tool, type the action you want. For example, search for “Show Changes” to inspect a diff of supported edits made inside DevTools, or type “screenshot” to discover the current capture commands.
The Chrome DevTools Command Menu guide explains how to find commands and capture page regions. Command names and available entries can vary between Chrome versions, so choose the entry displayed by your installed version instead of relying on a memorized menu position.
5. Find Broken Images and Requests in Network
When an image, font or stylesheet does not appear, do not assume the problem is CSS. Open Network, ensure request recording is active and reload the page. In the Network panel, Command + E starts or stops recording; Command + R records a reload when that panel is focused.
Worked example: a missing hero image
Suppose an image appears broken after you moved files into a new folder. Check the request URL and HTTP status in Network. A 404 response may indicate an incorrect file path, a filename case mismatch or a file missing from the deployed build. The status identifies a failed request; it does not by itself prove which of those causes is responsible.
Compare the requested image URL with the actual deployed asset path. Correct the HTML, CSS or build configuration where the reference originates; reload and verify the request succeeds. If a file returns 200 but still looks wrong, inspect its type, dimensions and CSS separately.
Chrome’s Inspect network activity guide documents how to examine request headers, timing, status and resource details.
6. Check JavaScript Errors in the Console
Press Command + Option + J from the browser viewport to open Console. Review error messages for the affected page and note which script and line are mentioned. Command + K clears the current Console view when that panel has focus; clearing the output does not repair the underlying fault.
Worked example: a menu button does nothing
A mobile navigation button may be present in the page but not respond to clicks. Check the Console for JavaScript errors, and inspect whether the intended button is selected by the page’s script. In a development environment you control, a small read-only DOM query may help:
document.querySelector('.menu-toggle')
If this returns null, inspect the rendered DOM and the selector in your project. If it returns an element, continue investigating event listeners, script loading and execution failures rather than declaring the menu fixed. Never paste unfamiliar scripts into Console on a production website or a site containing sensitive data.
7. Test Responsive Layouts with Device Mode
With DevTools focused, press Command + Shift + M to toggle the device toolbar. Try a narrow viewport, a tablet-sized width and a wider desktop width. Inspect the elements that matter most: navigation, headings, image crops, product cards, calls to action and forms.
Device mode simulates viewport conditions and offers useful testing controls, but it is not a complete substitute for a real phone. Chrome explicitly documents this limitation in its device mode guide.
After finding a failure, record the page URL, viewport width, browser version, element affected and what changes after your source fix. This helps another developer reproduce the issue.
8. Search Code and Track Temporary Changes
Command + F searches within the current supported DevTools panel, while Command + Option + F opens a search across loaded resources. Use the second when you remember a CSS class or JavaScript function but do not know which loaded file contains it. Command + P can open a source file in DevTools.
When you experiment with CSS in Elements, use the Changes panel to review the edits made during the session. Chrome documents that ordinary DevTools changes can disappear when the page or DevTools is reloaded. If you need persistence, use a configured Workspace or Local overrides rather than assuming the temporary state becomes a deployed change.
Once you identify the required change, our VS Code keyboard shortcuts for Mac guide can help you navigate the project, update source files, and review your edits more efficiently.
For additional context, see Google’s Changes panel documentation.
9. Capture Evidence Without Misrepresenting a Test
Use Command + Shift + P to open the Command Menu, then search for the screenshot action you need. A selected-area image can document a layout defect, while a full-size page capture can provide a more complete view. Check the available command labels in your current Chrome version.
A useful bug report includes a screenshot plus the affected URL, viewport dimensions, steps to reproduce, expected result, observed result and test date. Screenshots should not expose private customer information or credentials.
For a more consistent QA handoff, you can use macOS Shortcuts automation for website QA notes to prepare a formatted issue summary without automatically submitting it.
DevTools is useful for inspecting semantic structure and debugging controls, but a successful inspection does not constitute a full accessibility assessment. For a separate evaluation of keyboard access, focus, contrast, forms and more, refer to WebbyTemplate’s website template accessibility checklist.
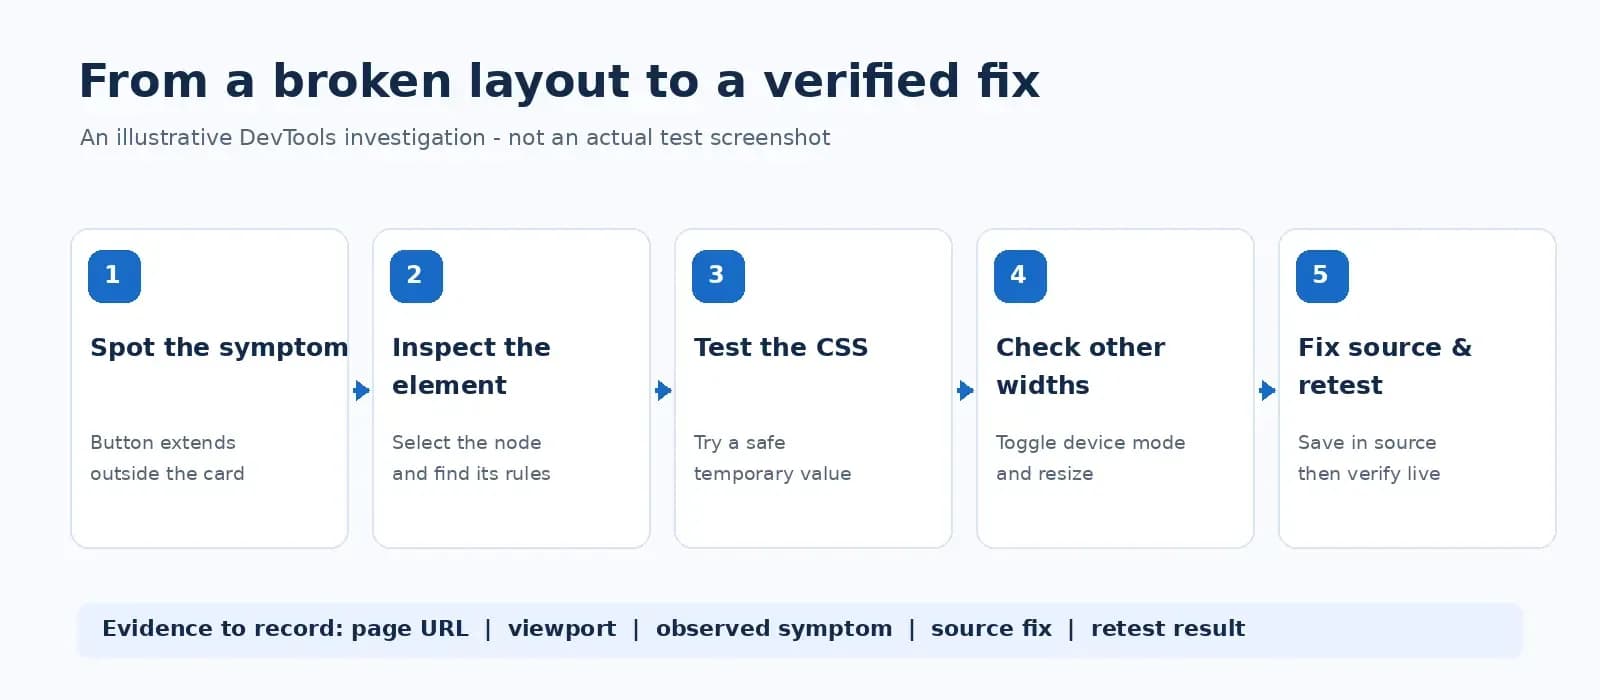
Illustrative five-step debugging method; not an actual product test.
10. A Repeatable Ten-Minute Template Debugging Workflow
| Step | Shortcut or Tool | Evidence / Outcome |
|---|---|---|
| 1. Identify the Failure | Open the page; Command + Option + I | URL, browser and affected area |
| 2. Inspect the Element | Command + Shift + C | Element, computed style and dimensions |
| 3. Check Resources | Network panel; Command + E as needed | Request URL, status and headers |
| 4. Test Narrow Layouts | Command + Shift + M | Viewport sizes where the issue appears |
| 5. Investigate Scripts | Command + Option + J | Specific console errors, if any |
| 6. Compare a Proposed Fix | Elements panel + Changes panel | Temporary CSS or DOM findings |
| 7. Update the Real Project | Source editor / build workflow | Committed or saved source change |
| 8. Verify and Document | Reload + screenshot capture | Retest result and evidence |
This sequence is a decision framework, not a promise that every issue can be solved in ten minutes. The purpose is to prevent repeated guessing and make the result transferable to the person who maintains the site.
Common Chrome DevTools Shortcut Mistakes on Mac
| What Happened | What to Check |
|---|---|
| A shortcut opens the wrong action | Confirm browser vs. DevTools focus and keyboard layout. |
| Device mode does not toggle | Focus DevTools, then retry Command + Shift + M. |
| A CSS change vanishes after reload | Save the fix in project source or configure persistence. |
| Network shows nothing after page load | Start recording and reload with the Network panel open. |
| Find searches the wrong area | Command + F searches within the current panel; Command + Option + F searches across loaded resources. |
| A mobile preview looks fine but the real phone fails | Treat device mode as a simulation; test on physical hardware. |
| The site looks fixed but deployment does not change | Confirm the correct source files, build, cache and deployment process. |
For general template performance and site-quality context beyond debugging shortcuts, read WebbyTemplate’s website optimization tips for template-based sites.
FAQs
Q1.
What is the shortcut to open Chrome DevTools on Mac?
Q2.
How do I open Inspect Element on a Mac?
Q3.
What shortcut opens the Chrome Console on Mac?
Q4.
How do I toggle responsive device mode in Chrome on Mac?
Q5.
How can I search all files loaded in DevTools?
Q6.
Why do my DevTools CSS edits disappear after reloading?
Q7.
Can Chrome DevTools fix broken images by itself?
Q8.
Are these shortcuts the same on Windows?
Final Thoughts
Chrome DevTools shortcuts on Mac are most valuable when they help you solve a real problem. Use them to locate the affected HTML, verify the applied CSS, inspect resource failures, test layouts at different widths and document what changed. Then fix the real source and retest the published result. A concise, repeatable investigation is more useful than memorizing dozens of commands without knowing when to use them.